Home > G. Anomaly Detection > View the anomaly dispatch table
Step-by-step guide
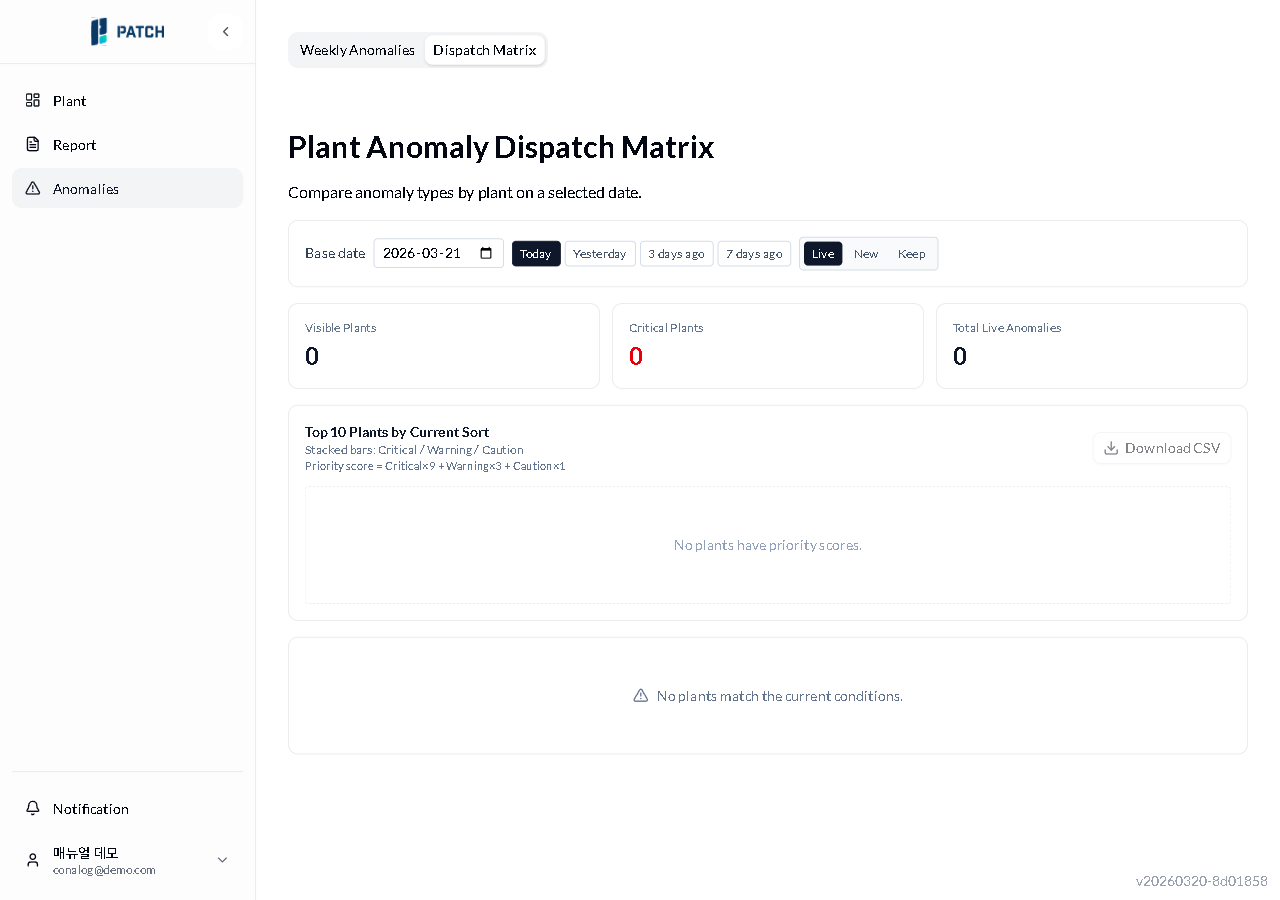
View the anomaly dispatch table
Compare per-plant anomalies by date and status in the dispatch table, and export the data as CSV.
Estimated time: 5~6min · Last updated: 2026-03-21
How to
When you want to compare anomaly counts across plants for a specific date
Starting state: You are logged in to PATCH, The anomaly detection screen is open
Click the Anomaly Dispatch Table tab at the top. The plant anomaly summary table appears.
To change the reference date, click a preset button (Today, Yesterday, 3 Days Ago, 7 Days Ago) or pick a date from the date picker.
Click one of the status buttons (In Progress, New, Ongoing) to filter anomalies by that status. The selected button is highlighted.
To download the data, click CSV Download on the right. A CSV file is saved with data matching the current filters.
The TOP 10 plants by priority score (Critical×9 + Warning×3 + Caution×1) are shown as stacked bar charts. The Download CSV button is only active when data is available.
Expected result
Each time you change the date or status, the displayed plant count, critical plant count, and total anomaly count update, and the Top 10 plant chart refreshes accordingly.
If it does not work
If the table says there are no plants with a priority score, there are no anomalies on the selected date. Try a different date preset.
If the CSV file does not download, check your browser's download blocking settings.
Step-by-step screenshots
Follow the red-numbered hotspots in the images below alongside the steps above.
1. Click the Anomaly Dispatch Table tab at the top. The plant anomaly summary table appears.
1
이상감지 집계표
Anomaly summary table — reference date and status filter, CSV download visible
Anomaly summary table tab — currently selected
2. To change the reference date, click a preset button (Today, Yesterday, 3 Days Ago, 7 Days Ago) or pick a date from the date picker.
2
이상감지 집계표
Anomaly summary table — reference date and status filter, CSV download visible
Date selector area — date picker and preset buttons (today, yesterday, 3 days ago, 7 days ago)
3. Click one of the status buttons (In Progress, New, Ongoing) to filter anomalies by that status. The selected button is highlighted.
3
이상감지 집계표
Anomaly summary table — reference date and status filter, CSV download visible
Status filter buttons — In Progress (currently selected) / New / Ongoing
4. To download the data, click CSV Download on the right. A CSV file is saved with data matching the current filters.
4
이상감지 집계표
Anomaly summary table — reference date and status filter, CSV download visible
CSV download button — exports the current filtered summary data as a CSV file
5. The TOP 10 plants by priority score (Critical×9 + Warning×3 + Caution×1) are shown as stacked bar charts. The Download CSV button is only active when data is available.