Add or modify widgets on the dashboard to build a custom view.
Estimated time: 4~5min · Last updated: 2026-03-21
How to
When you want to change the default dashboard layout or add new widgets
Starting state: You are logged in to PATCH, The dashboard screen is open, You have an account with edit permissions
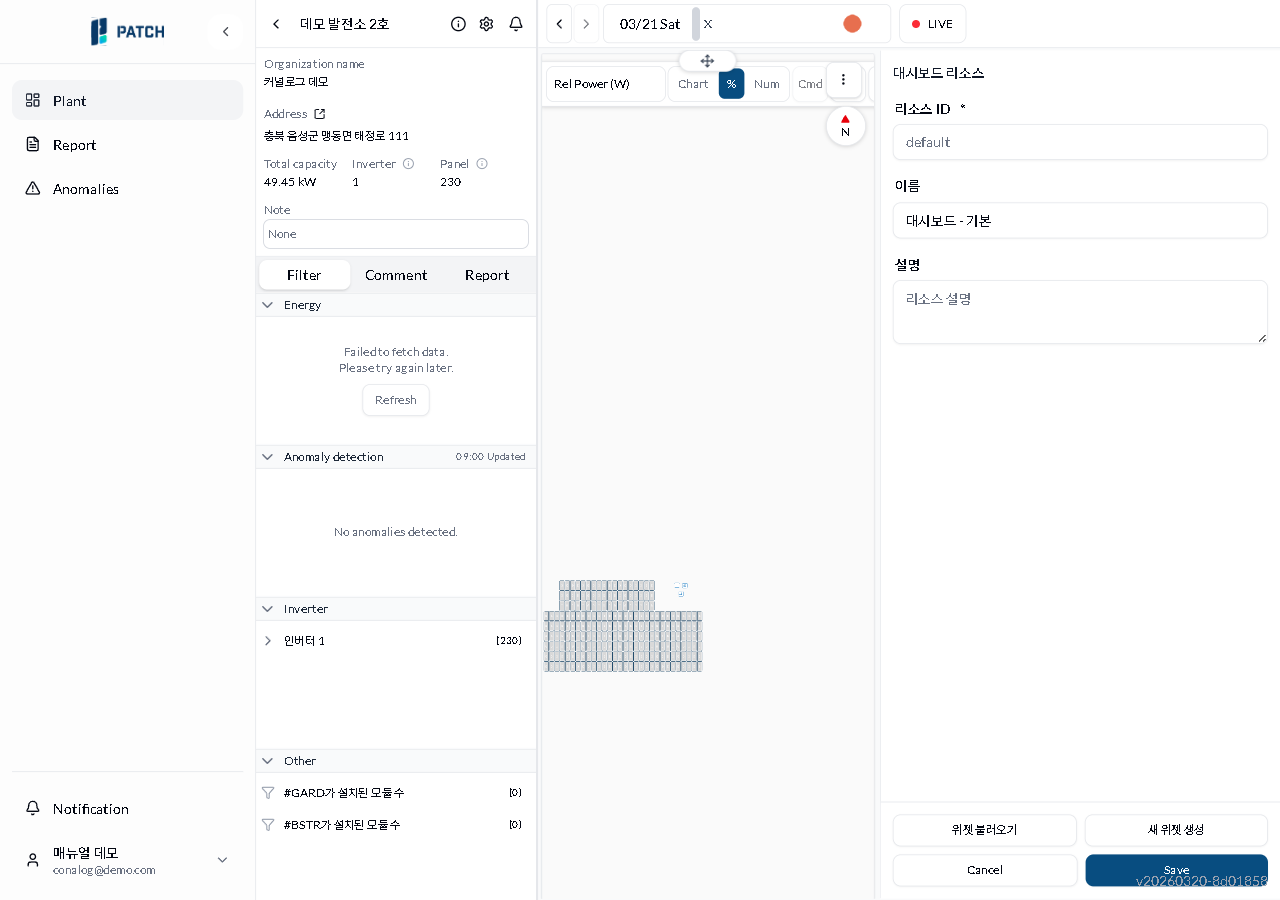
Click Edit Dashboard at the upper right of the dashboard. The view enters edit mode and a resource settings panel appears.
To reuse an existing widget, click Import Widget. To create one from scratch, click New Widget.
Click Load Widget to choose from 9 pre-built widgets (inverter chart, panel 5-min charts×4, panel table, plant daily/monthly charts, plant map). Click New Widget to configure chart type (Bar/Line/PlantMap/Table/TimeSeries) and data source manually.
When finished, click Save. Edit mode closes and the changes are applied to the dashboard.
Expected result
After saving, the dashboard reflects your edits. Added widgets appear on screen and modified settings take effect.
If it does not work
If the edit button is not visible, check your account permissions. Viewer accounts cannot edit.
If changes are not reflected after saving, refresh the browser (F5).
Step-by-step screenshots
Follow the red-numbered hotspots in the images below alongside the steps above.
1. Click Edit Dashboard at the upper right of the dashboard. The view enters edit mode and a resource settings panel appears.
3. Click Load Widget to choose from 9 pre-built widgets (inverter chart, panel 5-min charts×4, panel table, plant daily/monthly charts, plant map). Click New Widget to configure chart type (Bar/Line/PlantMap/Table/TimeSeries) and data source manually.
No screenshot linked to this step yet.
4. When finished, click Save. Edit mode closes and the changes are applied to the dashboard.