Home > D. Dashboard > Filter panels with the Filter tab
Step-by-step guide
Filter panels with the Filter tab
Use the Filter tab to narrow panels by inverter, anomaly, or tag, and access interpolation mode and commands.
Estimated time: 4~5min · Last updated: 2026-03-21
How to
When you want to see only panels connected to a specific inverter
Starting state: You are logged in to PATCH, The dashboard screen is open (Filter tab is visible on the left)
Expand the Energy section in the Filter tab to see three sub-groups: Top 10 (daily energy), Caution panels (<70% energy), and Abnormal panels (<30% energy). In the Inverter section, expand an inverter to reveal its strings (1st through 10th). Click a string to highlight only that string's panels on the map.
Expand the Anomaly Detection section to see anomalies by type (e.g., output degradation, shading). Click an item to highlight the affected panels.
Toggle Interpolation Mode from the three-dot menu. When enabled, missing data points are interpolated so the chart displays continuously.
For plants with MLPE devices, click Command to send control commands to the devices. In the command dialog, select the target and command, then send.
Expected result
Selecting an inverter shows only its panels. Clicking an anomaly highlights the related panels. Enabling interpolation fills gaps in the chart.
If it does not work
If the Filter tab is not visible, click the left edge of the dashboard or refresh the browser (F5).
If there is no Command button, the plant does not have MLPE devices registered.
Step-by-step screenshots
Follow the red-numbered hotspots in the images below alongside the steps above.
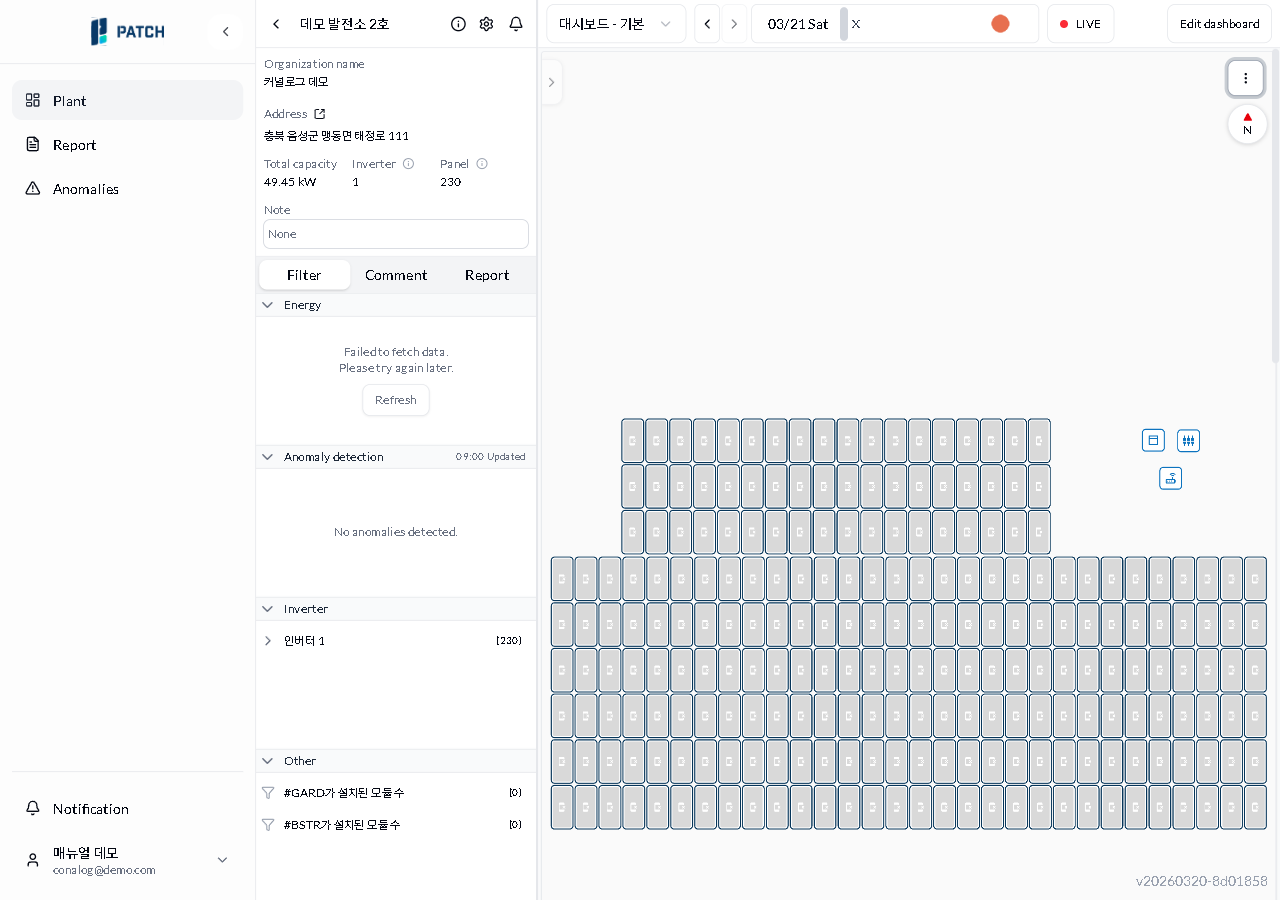
1. Expand the Energy section in the Filter tab to see three sub-groups: Top 10 (daily energy), Caution panels (<70% energy), and Abnormal panels (<30% energy). In the Inverter section, expand an inverter to reveal its strings (1st through 10th). Click a string to highlight only that string's panels on the map.
1
필터 탭이 보이는 대시보드 전체 화면
Dashboard filter tab — left panel showing inverter, anomaly detection, and other sections
Inverter section — select panels by inverter to display only those panels on the dashboard
2. Expand the Anomaly Detection section to see anomalies by type (e.g., output degradation, shading). Click an item to highlight the affected panels.
2
필터 탭이 보이는 대시보드 전체 화면
Dashboard filter tab — left panel showing inverter, anomaly detection, and other sections
Anomaly detection section — anomaly detection records for this plant displayed by type
3. Toggle Interpolation Mode from the three-dot menu. When enabled, missing data points are interpolated so the chart displays continuously.
3
보간 모드가 보이는 점 세 개 메뉴
Dot menu with interpolation mode toggle turned on
Interpolation mode toggle — when ON, data interpolation fills gaps in the chart
4. For plants with MLPE devices, click Command to send control commands to the devices. In the command dialog, select the target and command, then send.
4
필터 탭이 보이는 대시보드 전체 화면
Dashboard filter tab — left panel showing inverter, anomaly detection, and other sections
Command button — active only for plants with MLPE devices; sends commands to devices