Home > D. Dashboard > View generation status on the chart
Step-by-step guide
View generation status on the chart
View generation status on the dashboard chart, switch measurements, and navigate dates.
Estimated time: 6~7min · Last updated: 2026-03-22
How to
When you want to check real-time or historical generation data on a chart
Starting state: You are logged in to PATCH, You have clicked a plant in the list and the dashboard (/app/dashboard) is open
Click the measurement combo at the top and select the item you want to view (e.g., Relative Output, Current, Voltage). The chart redraws with the selected measurement.
Click the Chart / Percent / Number radio buttons to the right of the combo to switch the display mode. Selecting Percent converts each panel into a percentage bar.
Click < / > in the date area at the top to move one day backward or forward. To return to real-time data, click LIVE.
Use the zoom (+/-) buttons to resize the chart, the fullscreen button to expand the dashboard, and the collapse (>) button to hide the toolbar for a wider panel view.
Click a panel block to see its details in a popup — device status, coordinates, string assignment, power, current, voltage, and more. The selected panel gets a red border, and a selection count bar appears at the bottom with a clear button.
The weather icon next to the date shows weather info for that day. Turn on the LIVE button for real-time auto-refresh — the forward date button is disabled while LIVE is active.
Expected result
Changing the measurement refreshes the chart to that item. Switching modes changes the visual format. Navigating dates loads data for the selected day.
If it does not work
If the measurement combo does not respond, refresh the page (F5) and try again.
If the chart is empty after changing the date, there is no collected data for that day. Click LIVE to return to real-time.
Step-by-step screenshots
Follow the red-numbered hotspots in the images below alongside the steps above.
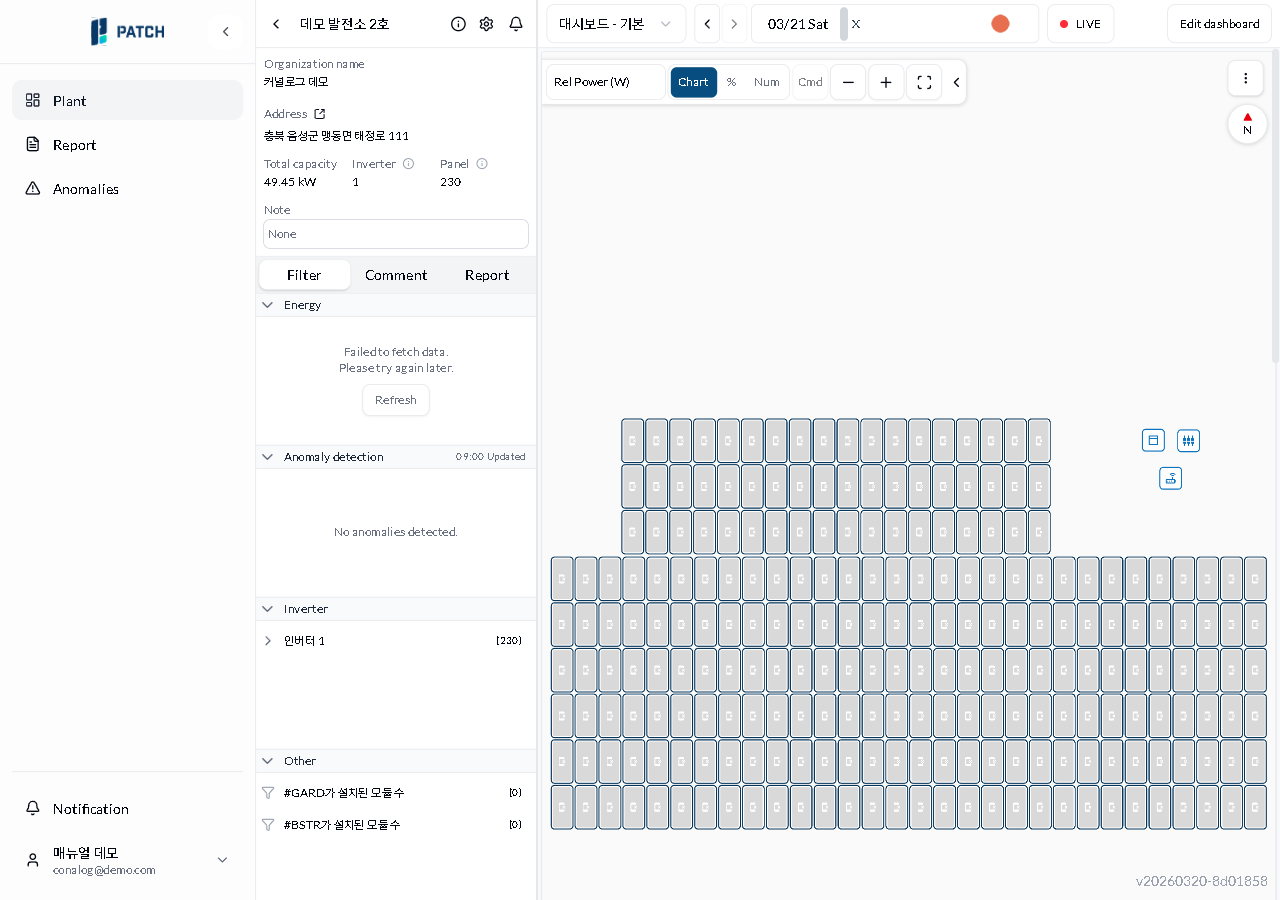
1. Click the measurement combo at the top and select the item you want to view (e.g., Relative Output, Current, Voltage). The chart redraws with the selected measurement.
1
차트 모드 전체 화면
Demo Plant 2 dashboard — relative power (W) chart mode, with filter tab visible
Measurement combo — click to open dropdown with 13 measurement types
1
측정값 콤보 드롭다운
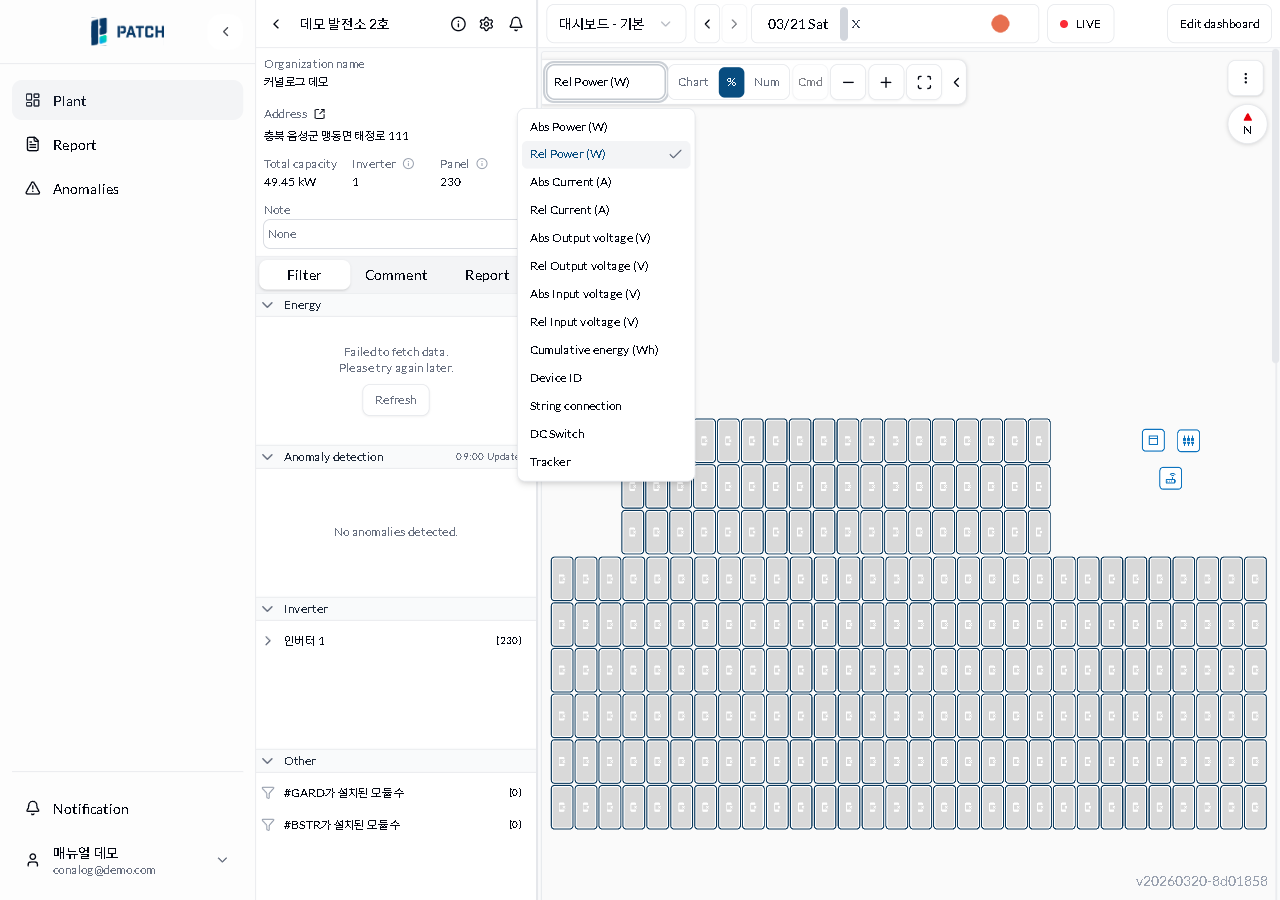
Measurement combo dropdown — 13 options expanded
Measurement dropdown list — absolute/relative power, current, voltage, cumulative generation, device ID, string wiring, DC switch, tracker, etc. (13 types)
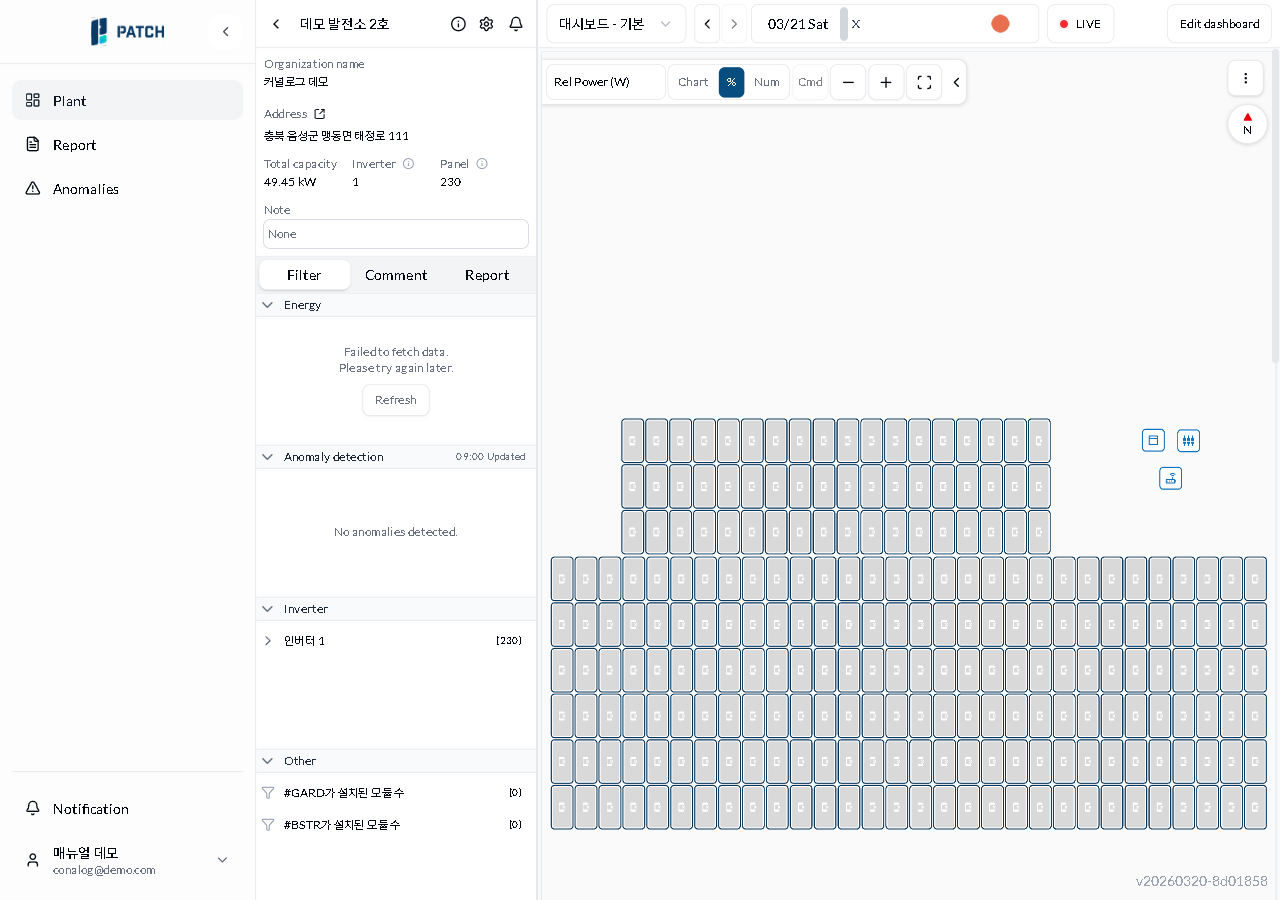
2. Click the Chart / Percent / Number radio buttons to the right of the combo to switch the display mode. Selecting Percent converts each panel into a percentage bar.
2
차트 모드 전체 화면
Demo Plant 2 dashboard — relative power (W) chart mode, with filter tab visible
Chart/Percent/Number radio group — switch display mode
2
퍼센트 모드
Dashboard percent mode — percent radio button selected
Percent radio selected — each panel is displayed as a percentage bar
3. Click < / > in the date area at the top to move one day backward or forward. To return to real-time data, click LIVE.
3
차트 모드 전체 화면
Demo Plant 2 dashboard — relative power (W) chart mode, with filter tab visible
Date navigation area — use < (previous day), > (next day), LIVE button to navigate dates or return to real-time
4. Use the zoom (+/-) buttons to resize the chart, the fullscreen button to expand the dashboard, and the collapse (>) button to hide the toolbar for a wider panel view.
No screenshot linked to this step yet.
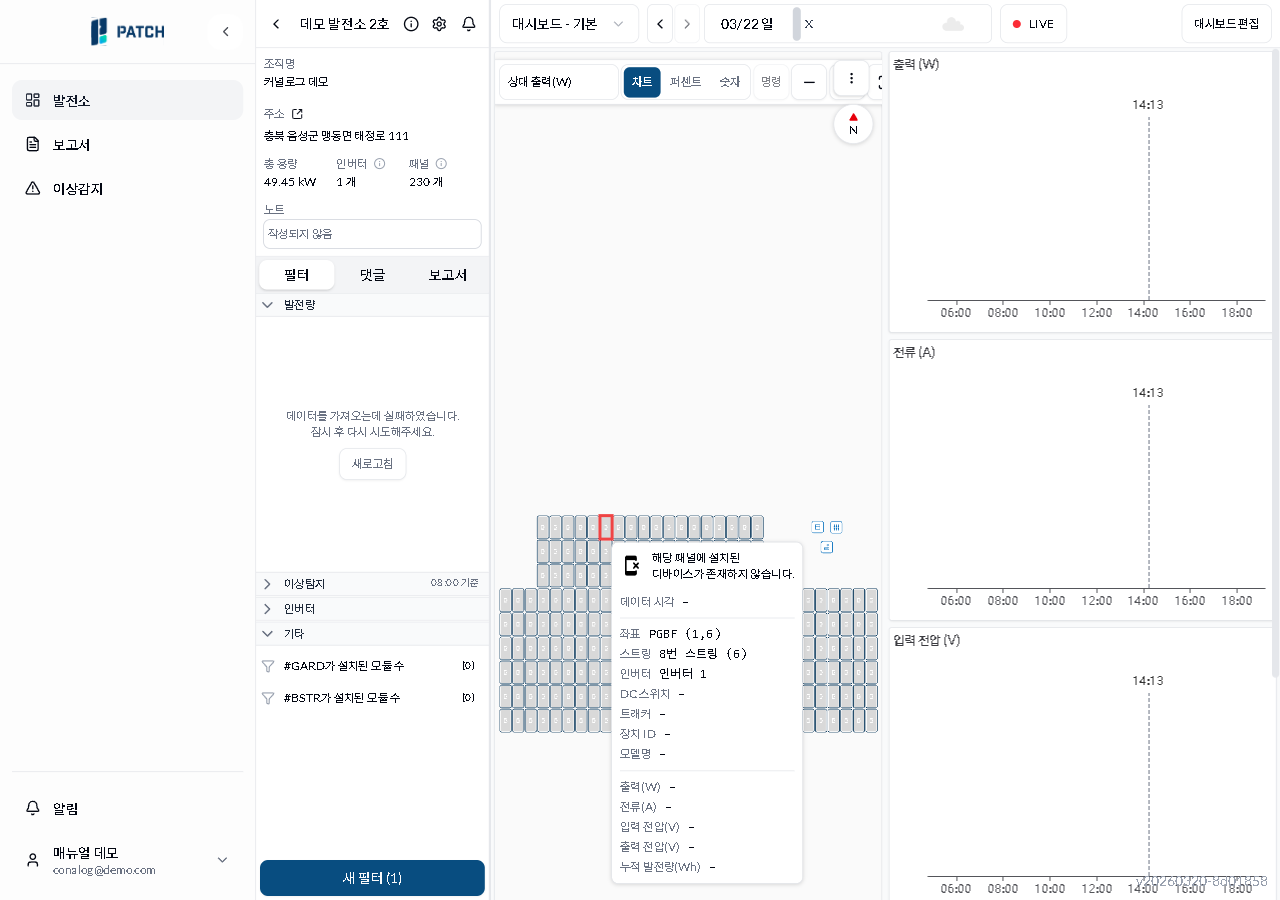
5. Click a panel block to see its details in a popup — device status, coordinates, string assignment, power, current, voltage, and more. The selected panel gets a red border, and a selection count bar appears at the bottom with a clear button.
55
패널 클릭 팝업
Panel block click popup — coordinates PGBF(1,6), string 8(6), inverter 1 info with output/current/voltage values, 'New filter(1)' button at bottom
New filter button — create a filter from the selected panel
6. The weather icon next to the date shows weather info for that day. Turn on the LIVE button for real-time auto-refresh — the forward date button is disabled while LIVE is active.